📈 Data Visualizations: Unlocking Insights with Charts and Graphs
Data visualizations are powerful tools that help individuals and organizations make sense of complex data sets. By representing data in graphical forms such as charts, graphs, and maps, we can easily identify patterns, trends, and outliers that might be challenging to discern from raw data alone.

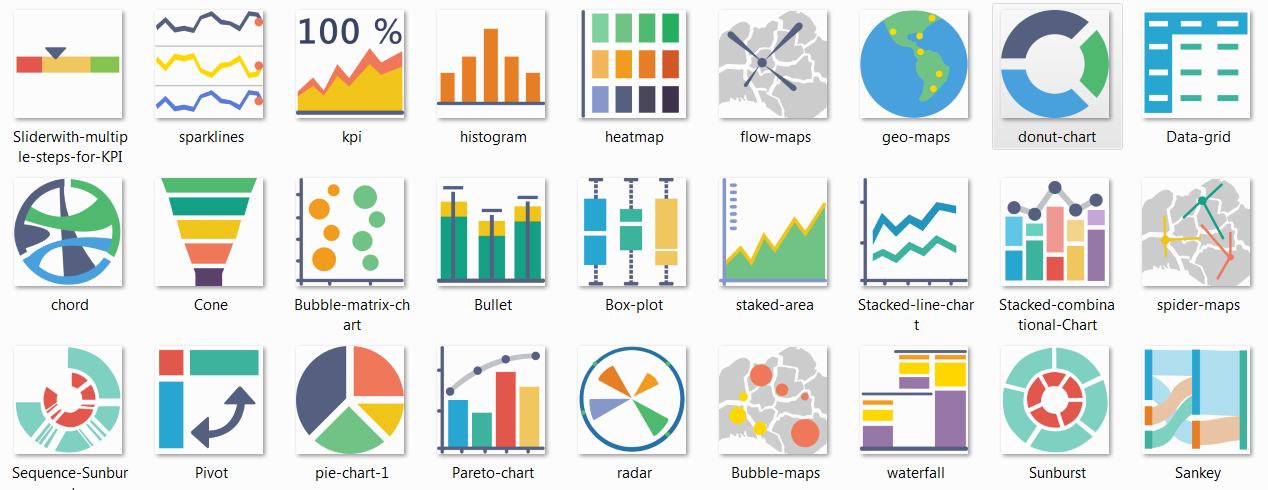
Figure-1: An example of data visualization
📜 Types of Data Visualizations
There are various types of data visualizations, each suited for specific data analysis tasks. Some common types include:
- Line charts
- Bar charts
- Pie charts
- Scatter plots
🔍 Why Data Visualizations Matter
Data visualizations matter because they:
- Provide insights quickly
- Facilitate data-driven decision-making
- Communicate complex information effectively
🧩 Creating Data Visualizations
To create data visualizations, you can use various tools and libraries, such as:
- Chart.js
- D3.js
- Tableau
- Power BI
🗃️ Best Practices
When creating data visualizations, consider these best practices:
- Choose the right type of chart for your data
- Label your axes and data points clearly
- Use colors strategically
- Keep it simple and avoid clutter

Figure-2: Data Scientists & DevOps Specialists workflow
💬 Conclusion
In conclusion, data visualizations play a crucial role in understanding and interpreting data. By leveraging the right tools and following best practices, anyone can create effective and insightful data visualizations. Whether you are analyzing business metrics, scientific data, or social trends, data visualizations are your key to unlocking valuable insights.